I have a new paper out in PLoS ONE (coauthored with Marcello Ruta) on the variation and evolution of skull shape in extant and fossil felids. Below, I'll outline a few key points:
1) We analysed the relationships of some extinct sabre-toothed cats, and their interrelationships with modern conical-toothed cats and basal (ancestral) cats using maximum parsimony analyses in PAUP* and TNT.
Our results show that all sabre-toothed cats (Machairodontinae, including species with shorter canines, intermediate in form between conical- and sabre-like morphologies) are more closely related to each other than any of them are to modern conical-toothed cats (Felinae).
 |
| Phylogeny of Felidae (doi:10.1371/journal.pone.0039752.g001) |
2) We quantified skull shape using traditional linear measurements (but adjusted for size, or isometric scaling) from over 300 cat skull specimens and:
A) We performed a linear discriminant analysis (LDA) to assess the ability of the linear morphometrics in distinguishing and correctly classifying group delimitations. For the taxonomic groups we used 'lineages': the eight extant lineages, 'Bay Cat', 'Caracal', 'Domestic Cat', 'Leopard Cat', 'Lynx', 'Ocelot', 'Panthera' and 'Puma' lineages; and three fossil lineages, 'Homotherium', 'Metailurus', and 'Smilodon' lineages. The three sabre-toothed cat (machairodontine) lineages are widely cited as being tribes, i.e. Homotheriini, Metailurini, and Smilodontini, in the palaeontological literature, but we opted to follow the practice observed in neontological literature and treated these groups as lineages. I'm just being pedantic here.
LDA revealed really high classification accuracy (overall 88.2% accuracy), which shows that traditional measurements can still be very powerful discriminators of taxonomic identity: this is really useful for museums where there may be specimens of as yet unknown identity (or suspicious identity).
B) We performed a principal components analysis (PCA) to construct a morphospace (shape-space) to investigate the patterns of variation in cat skull shape. PCA captures the major axes of variation in a multivariate dataset, each axis perfectly orthogonal (at right angle) to each other, so the resulting morphospace (e.g. a scatterplot of PC1 against PC2) is a proper 'space', unlike a scatterplot of two variables; a bivariate plot arbitrarily has orthogonal axes, but PC axes are mathematically orthogonal.
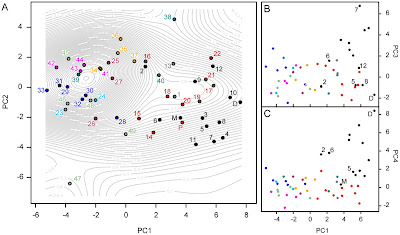 |
| Felid skull morphospace (doi:10.1371/journal.pone.0039752.g004) |
Our results show that there is a general size trend across morphospace distribution, but also that there is a notable separation between the modern small-medium (feline cats excepting 'Panthera' lineage cats) and modern large cats ('Panthera' lineage cats). Sabre-toothed cats generally plot out on the periphery of the 'Panthera' lineage distribution.
3) We investigated patterns of skull shape evolution across phylogeny and through time. This was achieved through estimating ancestral positions through shape-space and time, an extension of the phylomorphospace approach (Sidlauskas 2008) by the addition of a time axis.
Below is a normal two-dimensional phylomorphospace, with a phylogeny superimposed onto a morphospace delimited by the first two principal components axes. The internal nodal positions are estimated using maximum likelihood ancestral character estimation (Schluter et al. 1997).
Below is a normal two-dimensional phylomorphospace, with a phylogeny superimposed onto a morphospace delimited by the first two principal components axes. The internal nodal positions are estimated using maximum likelihood ancestral character estimation (Schluter et al. 1997).
 |
| Phylomorphospace (doi:10.1371/journal.pone.0039752.g005) |
We basically then simply added a time axis to this plot as a third axis. This is easier said than done, especially when you're trying to code this in R. But I did manage to get it plotted the way I wanted and we decided to call the plot, chronophylomorphospace (CPMS):
 |
| Chronophylomorphospace (doi:10.1371/journal.pone.0039752.g006) |
I wrote a R function called chronoPTS (short for chronophylotraitspace, because this method is not limited to morphospace), which outputs something like the one above, but this one is retouched for publication so the raw output looks a bit rougher. I used the rgl R package to accomplish this, so the neat thing is, you can save a spinning gif animation:
 |
| Spinning CPMS! (Supplementary VideoS1 accompanying the paper.) |
Inspection of the CPMS shows that there was an early and conspicuous divergence between the conical-toothed cats and sabre-toothed cats. It is evident that these two major cat groups diverged early in their evolutionary history and followed separate evolutionary trajectories.
Within the modern group of conical-toothed cats, the separation between the small-medium and large cats is also deeply rooted, with a divergence in skull shape early in their evolutionary history. This means that small-medium cats and large cats followed different evolutionary trajectories with respect to skull shape.
Large conical toothed cats ('Panthera' lineage cats) have moved into regions of morphospace that were previously occupied by sabre-tooth cats. Thus, there is a form of sequential morphospace filling, whereby sabre-toothed ancestors first occupied the ‘large-cat’ region of morphospace, followed by a migration out of that region by the descendant sabre-toothed species into a new and unique region of morphospace, and finally by the subsequent filling of the now empty ‘large cat’ region by conical-toothed cats.
Our new paper:
- Sakamoto M. & Ruta M. 2012. Convergence and divergence in the evolution of cat skulls: temporal and spatial patterns of morphological diversity. PLoS ONE 7(7): e39752. doi:10.1371/journal.pone.0039752
- Schluter D., Price T., Mooers A.O., Ludwig D. 1997. Likelihood of ancestor states in adaptive radiation. Evolution 51(6), 1699-1711.
- Sidlauskas B. 2008. Continuous and arrested morphological diversification in sister clades of characiform fishes: a phylomorphospace approach. Evolution 62(12), 3135-3156.
Comments